Feature Statistics
Computing summary statistics is one of the most common tasks that data
scientists do during an exploratory data analysis (EDA). The goal of
the .feature_stat() method is to produce relevant summary statistics
for the feature set. The feature type framework allows you to customize
what statistics are used in a feature type. It also standardizes the way
those statistics are returned. This empowers you to produce visualizations,
and other tools that can use the standardized output.
Using
The .feature_stat() is used to compute the feature statistics,
and it is defined on a Pandas Series and dataframe. In both cases,
the method returns a row-dominate dataframe where each row
represents a single observation. In each case, there are
columns that represent the metric that was computed and the value.
When it is called on a dataframe, there is one other column
that represents the feature that the metric was computed for.
Dataframe
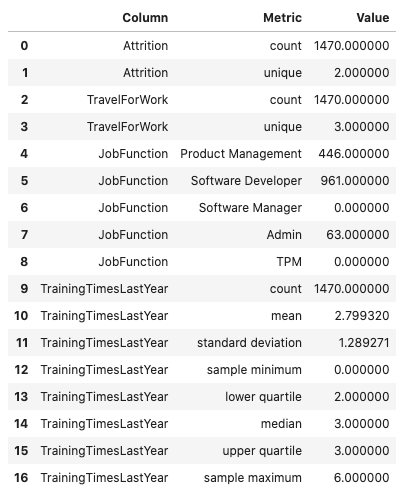
The .feature_stat() method also works at the dataframe level. It
produces a similar output to that of the series, except it
has an additional column that lists the column name where the
metric was computed.
df.ads.feature_stat()
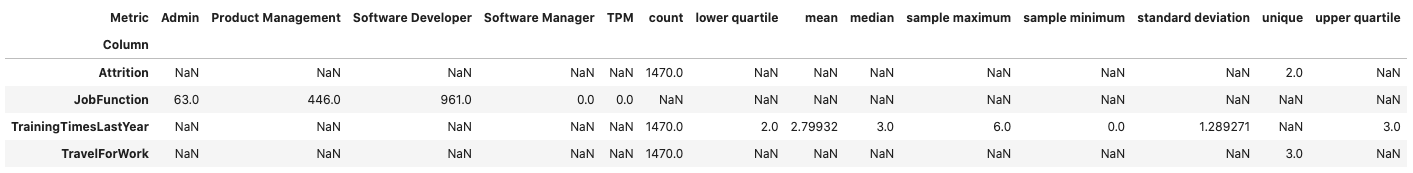
Reshaping the Output
The .feature_stat() method outputs its data in a row-dominate format
to make it easy to work with. However, there are times when a column
dominate format helps to better understand the data. This is often the
case when the data all have similar summary statistics. You can convert from
the row-dominate to the column-dominate format with the
.pivot_table() method, which is part of Pandas. When there are
missing values, an NaN is inserted.
df.ads.feature_stat().pivot_table(index='Column', columns='Metric', values = 'Value')
Series
The .feature_stat() outputs a Pandas dataframe where each row
represents a summary statistic. This is called the row-dominate format.
The statistics that are reported depending on the inheritance chain of
the feature types. The feature type framework iterates from the primary
feature type to the default feature type looking for a feature type
that has the .feature_stat() method defined and then dispatches on that.
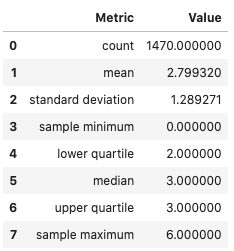
In the next example, the .feature_stat() for the integer feature type
is run. This feature set returns the count of the observations, the
mean value, the standard deviation, and Tukey’s Five Numbers (sample
minimum, lower quartile, median, upper quartile, and sample maximum).
df['TrainingTimesLastYear'].ads.feature_stat()
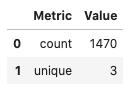
The summary statistics that you create depend on the feature type. For
example, assume that there is a dataframe, df, that has a column
named JobFunction and the dtype is categorical. Thus, its default
feature type is also categorical. A call to .feature_type_stat()
produces a count of the number of observations, and the number of
unique categories:
df['JobFunction'].ads.feature_stat()
Custom Feature Statistics
You can create custom summary statistics when working with
a custom feature type. The previous example with the JobFunction
statistics, they might not be an ideal summary for this feature. Instead,
you might want to know the number of job functions in each category.
You can create a new feature type and it is associated .feature_stat()
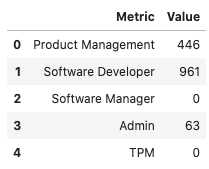
method. In the next example, a new custom feature type called
JobFunction is created. It overrides the .feature_stat()
method to produce a count of the number of each job functions in the
data. This feature type is then registered and the dataframe JobFunction
column is updated so that it now inherits from the JobFunction
feature type. Then it prints the feature summary statistics for the
JobFunction column.
To create a custom feature statistics, in the class that you are using
to create the custom feature, override the feature_stat method.
This method must be static. It accepts a Pandas Series and returns
a dataframe. The series is the values in the feature that you
are computing the statistic for so you must know the dtype
that will be passed in.
The resulting dataframe must have the columns Metric and Value.
The Metric column is a string that defines the metric that is
being computed. The Value column is a floating-point value of the
metric that was computed.
If there are no metrics that are to be returned, then an empty dataframe with these columns must be returned. There is no limit to the number of metrics that can be returned.
from ads.feature_engineering import feature_type_manager, FeatureType

# Create the JobFunction feature type
class JobFunction(FeatureType):
    @staticmethod
    def feature_stat(series: pd.Series) -> pd.DataFrame:
        result = dict()
        job_function = ['Product Management', 'Software Developer', 'Software Manager', 'Admin', 'TPM']
        for label in job_function:
            result[label] = len(series[series == label])
        return pd.DataFrame.from_dict(result, orient='index', columns=[series.name])

# Register the JobFunction feature type and assign it to the dataframe
feature_type_manager.feature_type_register(JobFunction)
df['JobFunction'].ads.feature_type = ['job_function', 'category']
df['JobFunction'].ads.feature_stat()