WhatIf Explainer
Description
The WhatIf explainer tool helps to understand how changes in an observation affect a model’s prediction. Use it to explore a model’s behavior on a single observation or the entire dataset by asking “what if” questions.
The WhatIf explainer has the following methods:
explore_predictions: Explore the relationship between feature values and the model predictions.explore_sample: Modify the values in an observation and see how the prediction changes.
Example
In this example, a WhatIf explainer is created, and then the explore_predictions(), and explore_sample() methods are demonstrated. A tree-based model is used to make predictions on the Boston housing dataset.
from ads.common.model import ADSModel
from ads.dataset.dataset_browser import DatasetBrowser
from ads.dataset.label_encoder import DataFrameLabelEncoder
from ads.explanations.explainer import ADSExplainer
from ads.explanations.mlx_whatif_explainer import MLXWhatIfExplainer
from sklearn.ensemble import ExtraTreesRegressor
from sklearn.pipeline import make_pipeline
from sklearn.preprocessing import LabelEncoder
import logging
import warnings

logging.basicConfig(format='%(levelname)s:%(message)s', level=logging.ERROR)
warnings.filterwarnings('ignore')

ds = DatasetBrowser.sklearn().open("boston").set_target("target")
train, test = ds.train_test_split(test_size=0.2)

X_boston = train.X.copy()
y_boston = train.y.copy()

le = DataFrameLabelEncoder()
X_boston = le.fit_transform(X_boston)

# Model Training
ensemble_regressor = ExtraTreesRegressor(n_estimators=245, random_state=42)
ensemble_regressor.fit(X_boston, y_boston)
model = ADSModel.from_estimator(make_pipeline(le, ensemble_regressor), name="ExtraTreesRegressor")

# Build a WhatIf Explainer
explainer = ADSExplainer(test, model, training_data=train)
whatif_explainer = explainer.whatif_explanation(provider=MLXWhatIfExplainer())
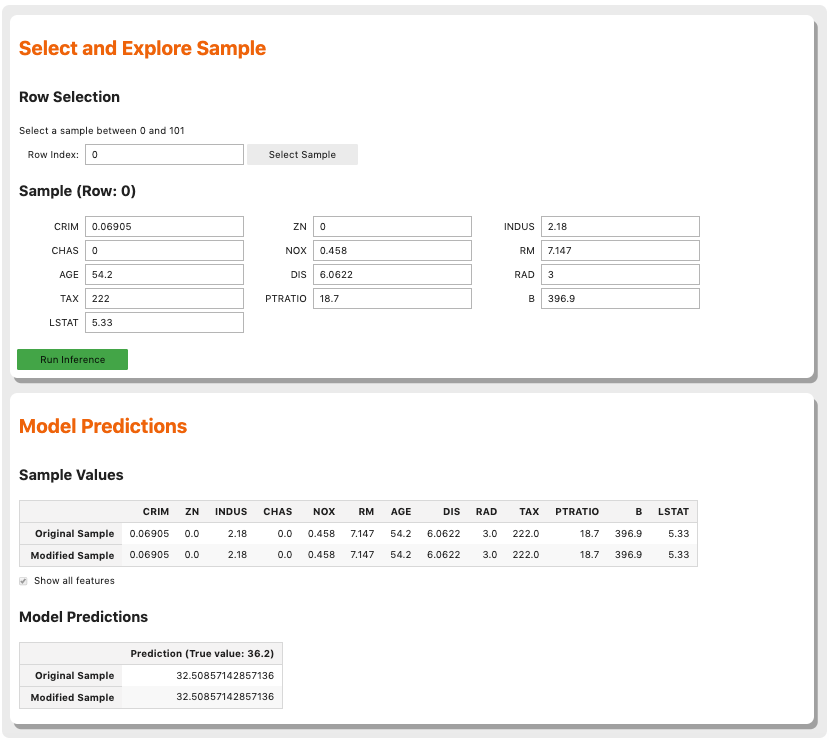
The Sample Explorer method, explore_sample(), opens a GUI that has a single observation. The values of that sample can then be changed. By clicking Run Inference, the model computes the prediction with the updated feature values. The interface shows the original values and the values that have been changed.
example_sample() accepts the row_idx parameter that specifies the index of the observation that is to be evaluated. The default is zero (0). The features parameter lists the feature names that are shown in the interface. By default, it displays all features. For datasets with a large number of features, this can be cumbersome so the max_features parameter can be used to display only the first n features.
The following command opens the Sample Explorer. Change the values then click Run Inference to see how the prediction changes.
whatif_explainer.explore_sample()
The Predictions Explorer method, explore_predictions(), allows the exploration of model predictions across either the marginal distribution (1-feature) or the joint distribution (2-features).
The method explore_predictions() has several optional parameters including:
x: (str, optional) Feature column on x-axis. The default is None.y: (str, optional) Feature column or model prediction column on the y-axis, by default it is the target.label: (str or int, optional) Target label or target class name to explore only for classification problems. The default is None.plot_type: (str, optional) Type of plot. For classification problems the valid options are ‘scatter’, ‘box’, or ‘bar’. For a regression problem, the valid options are ‘scatter’ or ‘box’. The default is ‘scatter’.discretization: (str, optional) Discretization method applies the x-axis if the featurexis continuous. The valid options are ‘quartile’, ‘decile’, or ‘percentile’. The default is None.
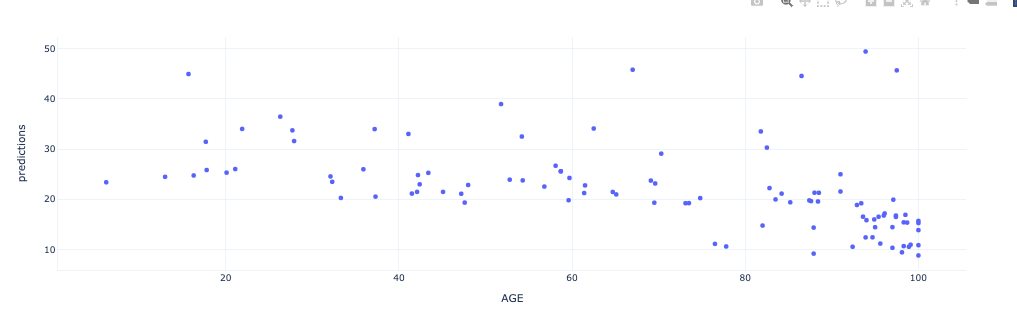
When only x is set, the chart shows the relationship between the features x and the target y.
whatif_explainer.explore_predictions(x='AGE')
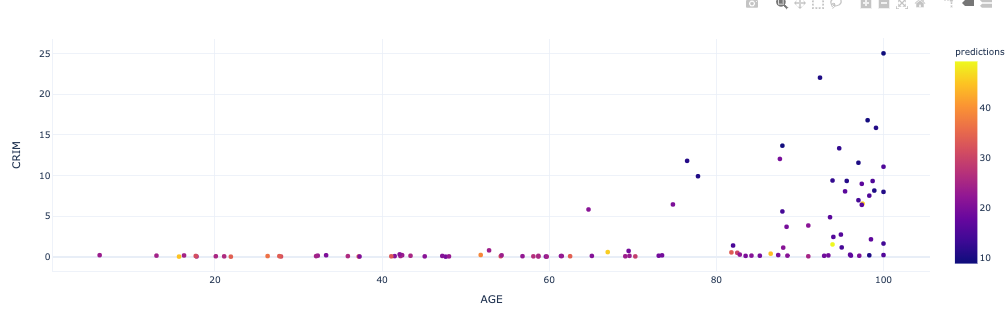
If features are specified for both x and y, the plot uses color to indicate the value of the target.
whatif_explainer.explore_predictions(x='AGE', y='CRIM')
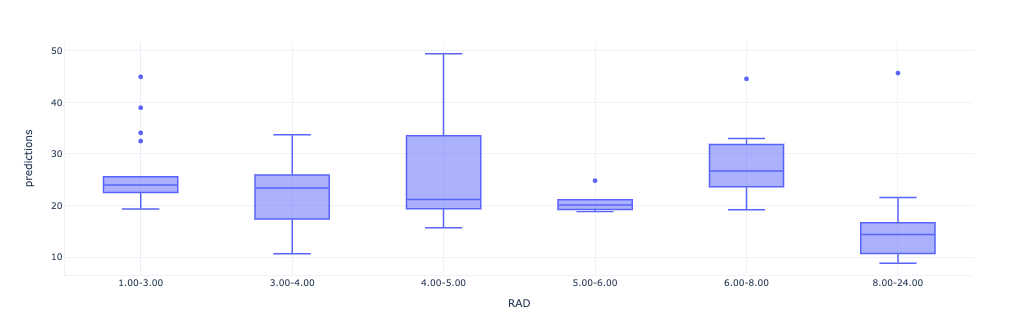
whatif_explainer.explore_predictions(x='RAD', plot_type='box', discretization='decile')