Transform Data#
When datasets are loaded, they can be transformed and manipulated easily with the built-in functions. Underlying, an ADSDataset object is a Pandas dataframe. Any operation that can be performed to a Pandas dataframe can also be applied to an ADS Dataset.
Loading the Dataset#
You can load a pandas dataframe into an ADSDataset by calling.
from ads.dataset.dataset import ADSDataset

ds = ADSDataset.from_dataframe(df)
Automated Transformations#
ADS has built in automatic transform tools for datasets. When the get_recommendations() tool is applied to an ADSDataset object, it shows the user detected issues with the data and recommends changes to apply to the dataset. You can accept the changes is as easy as clicking a button in the drop down menu. After all the changes are applied, the transformed dataset can be retrieved by calling get_transformed_dataset().
wine_ds.get_recommendations()
Alternatively, you can use auto_transform() to apply all the recommended transformations at once. auto_transform() returns a transformed dataset with several optimizations applied automatically. The optimizations include:
Dropping constant and primary key columns, which has no predictive quality.
Imputation to fill in missing values in noisy data.
Dropping strongly co-correlated columns that tend to produce less generalizable models.
Balancing a dataset using up or down sampling.
One optional argument to auto_transform() is fix_imbalance, which is set to True by default. When True, auto_transform() corrects any imbalance between the classes. ADS downsamples the dominant class first unless there are too few data points. In that case, ADS upsamples the minority class.
ds = wine_ds.auto_transform()
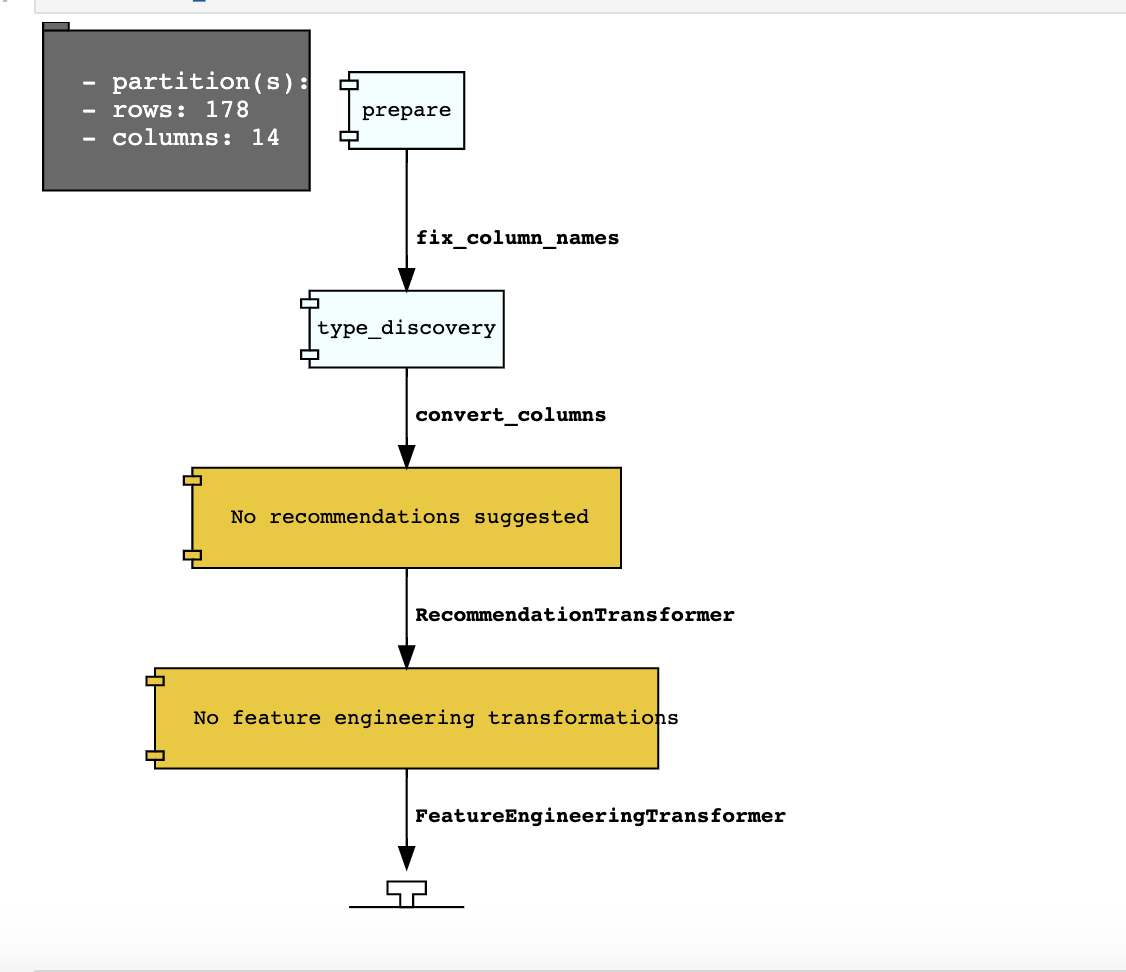
You can visualize the transformation that has been performed on a dataset by calling visualize_transforms().
Note
visualize_transforms() is only applied to the automated transformations and does not capture any custom transformations that you may have applied to the dataset.
ds.visualize_transforms()
Row Operations#
The operations that can be applied to a Pandas dataframe can be applied to an ADSDataset object.
Examples of some of the most common row operations you can apply on an ADSDataset object follow.
Delete Rows#
Rows within a dataset can be filtered out by row numbers. The index of the new dataset can be reset accordingly.
#Filter out rows by row number and reset index of new data
ds_subset = ds.loc[10:100]
ds_subset = ds_subset.reset_index()
Do not try to insert index into dataset columns.
Reset Index#
Reset the index to the default index. When you reset index, the old index is added as a column index and a new sequential index is used. You can use the drop parameter to avoid the old index being added as a column:
ds_subset = ds.loc[10:100]
ds_subset = ds_subset.reset_index(drop=True)
ds_subset.head()
The index restarts at zero for each partition. This is due to the inability to statically know the full length of the index.
Append Rows#
New rows can be added to an existing dataset:
#Create new row to be added
row_to_add = ds.loc[0]
row_to_add['target'] = 'class_0'

#Add in new row to existing dataset
new_addition_ds = ds.merge(row_to_add, how = 'outer')
Alternatively, you can use the append() method of a Pandas dataframe to achieve a similar result:
ds2 = wine_ds.df.append(ds)
The ds2 is created as a Pandas DataFrame object.
Row Filtering#
Columns can be filtered out by the values:
ds_filtered = ds[(ds['alcohol'] > 13.0) & (ds['malic_acid'] < 2.5)]
ds_filtered.head()
Removing Duplicated Rows#
Duplicate rows can removed using the drop_duplicates function:
ds_without_dup = ds.drop_duplicates()
Column Operations#
The column operations that can be applied to a Pandas dataframe can be applied to an ADS dataset as in the following examples.
Delete a Column#
To delete specific columns from the dataset, the drop_columns function can be used along with names of the columns to be deleted from the dataset. The ravel Pandas command returns the flattened underlying data as an ndarray. The name_of_df.columns[:].ravel() command returns the name of all the columns in a dataframe as an array.
ds_subset_columns = ds.drop_columns(['alcohol', 'malic_acid'])
ds_subset_columns.columns[:].ravel()
array(['ash', 'alcalinity_of_ash', 'magnesium', 'total_phenols',
    'flavanoids', 'nonflavanoid_phenols', 'proanthocyanins',
    'color_intensity', 'hue', 'od280/od315_of_diluted_wines',
    'proline', 'target'], dtype=object)
Rename a Column#
Columns can be renamed with the rename_columns() method:
ds_columns_rename = ds.rename_columns({'alcohol': 'alcohol_amount',
                                'malic_acid': 'malic_acid_amount'})
ds_columns_rename.columns[:].ravel()
array(['alcohol_amount', 'malic_acid_amount', 'ash', 'alcalinity_of_ash',
    'magnesium', 'total_phenols', 'flavanoids', 'nonflavanoid_phenols',
    'proanthocyanins', 'color_intensity', 'hue',
    'od280/od315_of_diluted_wines', 'proline', 'target'], dtype=object)
Counts of Unique Values#
The count per unique value can be obtained with the value_counts() method:
ds['target'].value_counts()
class_1    71
class_0    59
class_2    48
Name: target, dtype: int64
Normalize a Column#
You can apply a variety of normalization techniques to numerical columns (both continuous and discrete). You can leverage the built in max() and min() methods to perform a minmax normalization:
max_alcohol = wine_ds['alcohol'].max()
min_alcohol = wine_ds['alcohol'].min()
alcohol_range = max_alcohol  - min_alcohol
wine_ds.df['norm_alcohol'] = (wine_ds['alcohol'] / alcohol_range)
Combine Columns#
This example creates a new column by performing operations to combine two or more columns together:
new_feature_col = ((0.4)*wine_ds['total_phenols'] + (0.6)*wine_ds['flavanoids'])
ds_new_feature = wine_ds.assign_column('new_feature', new_feature_col)
ds_new_feature.head()
Alternatively, you can create a new column directly in the Pandas dataframe attribute:
new_feature_col = ((0.4)*wine_ds['total_phenols'] + (0.6)*wine_ds['flavanoids'])
wine_ds.df['new_feature'] = new_feature_col
wine_ds.head()
To add new column, use a new name for it. You can add anew column and change it by combining with existing column:
noise = np.random.normal(0,.1,wine_ds.shape[0])
ds_noise = wine_ds.assign_column('noise', noise)

ds_ash = ds_noise.assign_column('noise', ds_noise['noise'] + ds_noise['ash'])
ds_ash = ds_ash.rename(columns={'noise':'ash_with_noise'})
ds_ash.head()
The resulting column is renamed with dict-like mapper.
Apply a Function to a Column#
You can apply functions to update column values in existing column. This example updates the column in place using lambda expression:
wine_ds.assign_column('proline', lambda x: x is None or x > 1000)
wine_ds.head()
Change Data Type#
You can change the data type columns with the astype() method. ADS uses the Pandas method, astype(), on dataframe objects. For specifics, see astype for a Pandas Dataframe, using numpy.dtype, or Pandas dtypes.
When you change the type of a column, ADS updates its semantic type to categorical, continuous, datetime, or ordinal. For example, if you update a column type to integer, its semantic type updates to ordinal. For data type details, see ref:loading-data-specify-dtype.
This example converts a dataframe column from float, to the low-level integer type and ADS updates its semantic type to ordinal:
wine_ds = wine_ds.astype(types={'proline': 'int64'})
print(wine_ds.feature_types['proline']['low_level_type'])
print(wine_ds.feature_types['proline']['type'])

# Note: When you cast a float column to integer, you lose precision.
wine_ds['proline'].head()
To convert a column of type float to categorical, you convert it to integer first. This example converts a column data type from float to integer, then to categorical, and then the number of categories in the column is reduced:
# create a new dataset with a renamed column for binned data and update the values
ds = wine_ds.rename_columns({'color_intensity': 'color_intensity_bin'})
ds = ds.assign_column('color_intensity_bin', lambda x: x/3)

# convert the column from float to categorical:
ds = ds.astype(types={'color_intensity_bin': 'int64'})
ds = ds.astype(types={'color_intensity_bin': 'categorical'})
You can use feature_types to see if the semantic data type of the converted column is categorical:
wine_ds.feature_types['color_intensity_bin']['type']
'categorical'
The low-level type of the converted column is category:
ds['color_intensity_bin'].head()
0    1
1    1
2    1
3    2
4    1
Name: color_intensity_bin, dtype: category
Categories (5, int64): [0, 1, 2, 3, 4]
Dataset Manipulation#
ADS has built in functions that support categorical encoding, null values and imputation.
Categorical Encoding#
ADS has a built in categorical encoder that can be accessed by calling from ads.dataset.label_encoder import DataFrameLabelEncoder. This example encodes the three classes of wine that make up the dataset:
from ads.dataset.label_encoder import DataFrameLabelEncoder
ds_encoded = DataFrameLabelEncoder().fit_transform(ds.to_pandas())
ds_encoded['target'].value_counts()
1    71
0    59
2    48
One-Hot Encoding#
One-hot encoding transforms one categorical column with n categories into n or n-1 columns with indicator variables. You can prepare one of the columns to be categorical with categories low, medium, and high:
def convert_to_level(value):
    if value < 12:
        return 'low'
    elif value > 13:
        return 'high'
    else:
        return 'medium'

ds = wine_ds
ds = ds.assign_column('alcohol', convert_to_level)
You can use the Pandas method get_dummies() to perform one-hot encoding on a column. Use the prefix parameter to assign a prefix to the new columns that contain the indicator variables. This example creates n columns with one-hot encoding:
data = ds.to_pandas()['alcohol'] # data of which to get dummy indicators
onehot = pd.get_dummies(data, prefix='alcohol')
To create n-1 columns, use drop_first=True when converting the categorical column. You can add a one-hot column to the initial dataset with the merge() method:
data = ds.to_pandas()['alcohol'] # data of which to get dummy indicators
onehot = pd.get_dummies(data, prefix='alcohol', drop_first=False)
ds_onehot = ds.merge(onehot)
Encoding for all categorical columns can be accomplished with the fit_transform() method:
from ads.dataset.label_encoder import DataFrameLabelEncoder

ds_encoded = DataFrameLabelEncoder().fit_transform(ds_onehot.to_pandas())
ds_encoded['alcohol'].value_counts()
0    92
2    67
1    19
To drop the initial categorical column that you transformed into one-hot, use one of these examples:
ds_onehot = ds_onehot.drop_columns('alcohol')   # before ``fit_transform()`` method
# or
ds_encoded = ds_encoded.drop(columns='alcohol') # after ``fit_transform()`` method
Extract Null Values#
To detect all nulls in a dataset, use the isnull function to return a boolean dataset matching the dimension of our input:
ds_null = ds.isnull()
np.any(ds_null)
alcohol                         False
malic_acid                      False
ash                             False
alcalinity_of_ash               False
magnesium                       False
total_phenols                   False
flavanoids                      False
nonflavanoid_phenols            False
proanthocyanins                 False
color_intensity                 False
hue                             False
od280/od315_of_diluted_wines    False
proline                         False
target                          False
Imputation#
The fillna function ia used to replace null values with specific values. Generate a null value by replacing the entry below a certain value with null, and then imputing it with a value:
ds_with_null = ds.assign_column("malic_acid", lambda x: None if x < 2 else x)
ds_with_null['malic_acid'].head()
0     NaN
1     NaN
2    2.36
3     NaN
4    2.59
Name: malic_acid, dtype: float64
ds_impute = ds_with_null.fillna(method='bfill')
ds_impute['malic_acid'].head()
0    2.36
1    2.36
2    2.36
3    2.59
4    2.59
Name: malic_acid, dtype: float64
Combine Datasets#
ADS datasets can be merged and combined together to form a new dataset.
Join Datasets#
You can merge two datasets together with a database-styled join on columns or indexes by specifying the type of join left, right, outer, or inner. These type are defined by:
left: Use only keys from the left dataset, similar to SQL left outer join.right: Use only keys from the right dataset, similar to SQL right outer join.inner: Intersection of keys from both datasets, similar to SQL inner join.outer: Union of keys from both datasets, similar to SQL outer join.
This is an example of performing an outer join on two datasets. The datasets are subsets of the wine dataset, and each dataset contains only one class of wine.
ds_class1 = ds[ds['target']=='class_1']
ds_class2 = ds[ds['target']=='class_2']
ds_merged_outer = ds_class1.merge(ds_class2, how='outer')
ds_merged_outer['target'].value_counts()
class_1    71
class_2    48
class_0     0
Name: target, dtype: int64
Concatenate Datasets#
Two datasets can be concatenated along a particular axis (vertical or horizontal) with the option of performing set logic (union or intersection) of the indexes on the other axes. You can stack two datasets vertically with:
ds_concat = pd.concat([ds_class1, ds_class2], axis = 0)
ds_concat['target'].value_counts()
class_1    71
class_2    48
class_0     0
Name: target, dtype: int64
Train/Test Datasets#
After all data transformations are complete, you can split the data into a train and test or train, test, and validation set. To split data into a train and test set with a train size of 80% and test size of 20%:
from ads.dataset.dataset_browser import DatasetBrowser
sklearn = DatasetBrowser.sklearn()
wine_ds = sklearn.open('wine')
ds = wine_ds.auto_transform()
train, test = ds.train_test_split(test_size=0.2)
For a train, test, and validation set, the defaults are set to 80% of the data for training, 10% for testing, and 10% for validation. This example sets split to 70%, 15%, and 15%:
data_split = wine_ds.train_validation_test_split(
    test_size=0.15,
    validation_size=0.15
)
train, validation, test = data_split
print(data_split)   # print out shape of train, validation, test sets in split
The resulting three data subsets each have separate data (X) and labels (y).
print(train.X)  # print out all features in train dataset
print(train.y)  # print out labels in train dataset
You can split the dataset right after the ADSDatasetWithTarget.from_dataframe() statement:
ds = ADSDatasetWithTarget.from_dataframe(
    df=pd.read_csv("path/data.csv"),
    target="target"
)
train, test = ds.train_test_split(test_size=0.25)